2019 was marked by the decision of the Ugandan government to create nine cities by upgrading some municipalities to this status. This is the first ever creation of cities in Uganda’s independent history. To be implemented in a phased manner, the process will see five cities (Arua, Gulu, Jinja, Fort Portal, and Mbarara) becoming effective on 1 July 2020, another two (Hoima and Mbale) on 1 July 2021 and two more (Lira and Entebbe) officially launched at a later date. This development is grounded in a government’s long-term development blueprint called Vision 2040, which envisages establishment of four regional cities (Gulu, Mbale, Mbarara and Arua) and five strategic cities Hoima (oil), Nakasongola (industrial), Fort Portal (tourism), Moroto (mining), and Jinja (industrial) identified as part of the urban corridor development. But this decision is also an important recognition of Uganda’s progressive urbanisation, its opportunities and challenges as well as the urgent requirement for effective urban management, particularly at the level of secondary cities (all newly created cities have population below 250,000), to leverage those opportunities and deal with the challenges.
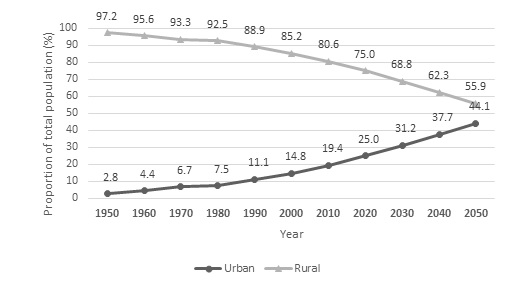
Uganda has been urbanising at a high rate of about 6 percent annually starting from the 1990s. Back then only 11 percent of Ugandans lived in urban areas; the estimates for 2020 are 25 percent. By 2050, almost have of Uganda’s population will be living in cities and towns (Figure 1).
Figure 1. Urban and rural population in Uganda, 1950-2050

Source: Author’s calculations using data from UNDESA (2018).
Uganda’s urban landscape includes a variety of urban centres whose population is distributed in a bimodal fashion. About one third is concentrated in the Kampala metropolitan area and 37 percent live in towns populated by less than 50,000 residents (see Table 1). Although Uganda complies with the general pattern of its regional peers with a primary city (usually the capital) dominating the landscape, Kampala proper is relatively small accounting for about 1.4 million, or 3.3 percent of the country’s total population (Nairobi, for comparison, accounts for 9.2 percent).
Table 1. Distribution of urban centres by size (2014) and poverty estimates (2019)
| Population of Urban Centre | Number of urban centres | Total population | Share of the total | Poverty estimates (proportion of population under the national poverty line, 2019) | |
| Average | Variation | ||||
| More than 250,000 | 2 | 1,829,971 | 28.5 | 2.6 | 1.3 |
| 100,000 – 250,000 | 7 | 959,859 | 14.9 | 4.8 | 6.8 |
| 50,000 – 100,000 | 12 | 852,500 | 13.3 | 7.7 | 12.3 |
| 25,000 – 50,000 | 27 | 1,005,469 | 15.6 | 11.4 | 18.3 |
| 10,000 – 25,000 | 90 | 1,382,763 | 21.5 | 17.5 | 17.0 |
| Less than 10,000 | 59 | 395,451 | 6.2 | 22.3 | 56.3 |
| Total | 197 | 6,426,013 | 100.0 |
Source: Author’s calculations using data from the Uganda Bureau of Statistics (UBOS), https://www.ubos.org/explore-statistics/20/.
This outcome is the result of the urbanisation trends in the past 40 years. Starting from mid-1970s and particularly after mid-1980s, with political and economic stabilization setting in after the turmoil years of dictatorship and civil war in the 1970s, secondary cities with population below 100,000 (in fact, no urban centers back then with the exception of Kampala was as big back then) have been growing faster than the capital metropolitan area ahead of the total urbanisation rate (Fig. 2). Growth of secondary cities picked up between 1980 and 2000 to almost 10 percent slowing down in the following decade to about seven percent. Although it has decelerated to 6.4 percent during the current decade, it still remains above the total urban growth and the growth in the Kampala metropolitan areas, which has remained pretty stable since 1990.
Figure 2. Decomposition of the urban growth, 1950-2020

Source: Author’s calculations using data from UNDESA (2018) and PopulationStat, https://populationstat.com/uganda/kampala.
The results of these growth trends are presented in Table 2.
Table 2. Evolution of key characteristics of urban and rural areas, 2005-2017

Source: Author’s calculations based on Dorosh and Turlow (2012), Rafa et al. (2017), UBOS (2018a).
The data in the table for 2005 are reproduced from Dorosh and Turlow (2012). The data for 2017 are calculated using the same methodology based on the use of the 2013 social accounting matrix (SAM) for Uganda (Randriamamonjy and Thurlow 2016) complemented with data from the 2016/17 Uganda National Household Survey and Bank of Uganda’s Private Sector Investment Report (for discussion of the methodology see Dorosh and Turlow 2012).
It shows the doubling of the share of secondary cities (towns) in 2005-2017 to 7.1 million inhabitants (from 9.3 to 16.6 percent). The growth of large cities in percentage points is not very impressive (0.5 percent) but it means an increase of over 1 million people. The table also indicates a trend of pauperization in secondary cities: the number of poor people there increased by 50 percent. In combination with a drop in rural poverty, this may imply an inflow of rural migrants to nearby urban areas. Unlike some other African countries where urbanisation is driven increasingly less by rural-to-urban migration and more by natural population growth, rural migration remains a major driving factor in Uganda’s urbanisation accounting for about 60% of the urban population growth. The data in this chapter refer to a period prior to the South Sudan refugee crisis that broke out in late 2017. Currently, Uganda is hosting about 1.3 million refugees, most of them from South Sudan. Many of them end up in urban areas (rather than in refugee settlements), and some towns in Northern Uganda (Yumbe, Moyo and Adjumani, for example) have experienced a significant inflow of Sudanese refugees.
Yet another interesting observation is a dramatic change in the GDP share of cities, which jumped from 19.6 to 43.3 percent. This is however more a classification issue than a reality. Four urban areas (all of them in the Greater Kampala Metropolitan Area, GKMA) have exceeded the threshold of 250,000 since 2005 and can be formally classified as cities. The peak in the GDP share of cities is an accounting transfer from secondary cities. The share of Kampala City is much more modest, 22.5 percent, a slight increase from 2005.
In addition, secondary cities are becoming somewhat more industrialised and less agriculture- and service-oriented. The government is actively promoting local economic development through industrialization, manufacturing, and agro-processing, and this may be an indication that these efforts are bearing fruit. Large cities, on the other hand, appear to be turning more towards services at the expense of the industrial sector. This may be a sign of future urban specialization where larger cities develop services while towns focus on industrial facilities.
Currently, about 70 percent of Ugandan urbanites live in secondary cities. At the present rate of growth (even taking into account some deceleration due to the demographic transition), the population of secondary cities is due to increase to about 35 million people by 2050, over 30 percent of the country’s total population (Figure 3).
Figure 3.

Source: Author’s calculations using data from UNDESA (2018) and PopulationStat, https://populationstat.com/uganda/kampala.
This brings into focus the issue of secondary cities. An environment that defines the wellbeing of over one third of the entire population is worth in-depth analysis and a serious policy consideration. The failure to achieve quality growth in secondary cities and realize their potential for structural transformation would imply the failure of Uganda’s development project.
Figure 4 takes a closer look at Uganda’s urban centres by their size of population in six categories: more than 250,000, from 100,000 to 250,000, from 50,000 to 100,000, from 25,000 to 50,000, from 10,000 to 25,000, and less than 10,000. What is remarkable about Uganda’s urban areas is not only their variation in size but also poverty distribution. Not only secondary cities in general are poor than the large ones but poverty is concentrated in towns with less than 50,000 residents, most of them living in towns hosting from 10,000 to 25,000 residents.
Figure 4. Poverty distribution in urban areas by size (size of the bubbles represents poverty shares)

Source: Author’s calculations based on Uganda Bureau of Statistics (UBOS), https://www.ubos.org/explore-statistics/20/.
A clear indication of the growing realisation by the government and other partners of the importance of urbanisation for the country’s development is a strong institutional framework for managing urbanisation that emerged over the past two decades. In 2006, the Ministry of Lands, Housing and Urban Development (MoLHUD) was established responsible for providing policy, legal and regulatory frameworks as well as setting national standards and guidelines, and coordinating all matters concerning urban development. The Urban Development Sector was created to coordinate the plans and activities of relevant government ministries, departments and agencies as part of the Institutional Framework for Coordination of Policy and Program Implementation in Government (IFCPPI) under the Office of the Prime Minister (OPM).
The National Vision 2040 stresses the importance of key strategies and policy reforms to ensure urbanisation that will bring about better urban systems to enhance productivity, livability and sustainability. The Second National Development Plan (2014/15-2019/20) unpacks this vision into a set of parctical measures, such as comprehensive physical planning for urban development, improved urban infrastructure services and utilities, an inclusive policy and regulatory framework for urban development, and availability of and access to land for urban expansion and investment. It commits the government to controlling urban sprawl through preparation and approval of integrated development plans which encourage increasing density of settlement by construction of high rise buildings and sticking to development controls. The recent years have seen the adoption of some fundamental policy documents , such as the National Land Policy (2013), National Local Economic Development Policy (LED) (2014), National Housing Policy (2016), National Urban Policy (2017).