How is Uganda doing on its structural transformation and what is the role of urban areas in this process?
Uganda’s economy has been experiencing structural transformation for the past two decades. This transformation is characterised by three features: a declining share of agriculture in GDP (from 42 percent in 1998/99 to 24.2 in 2017/18), a sluggish growth of the industrial sector (from 17 percent in 1998/99 to 19.9 in 2017/18), and a modest growth of services (from 42 percent in 1998/99 to 47.6 percent in 2017/18). In contrast, the share of manufacturing in GDP remained stagnant at between 8 and 9 percent. This structural transformation, marked with a transition to the service sector without industrialisation (and in some cases even accompanied with de-industrialisation) is typical of other countries in sub-Saharan Africa (Rodrik 2014, Bhorat et al. 2018)
Of course, the changes in the relative shares of sectors in the GDP are important only to the extent that they contribute to growth by inducing labour force movement from low productivity to high productivity activities usually associated with the non-agricultural sectors of economy. An analysis of productivity by sector of economy is presented in Figure 8.
Figure 8. Labour productivity by sector of economy (constant 2009/10 prices)

Source: Author’s calculations based on Dorosh and Turlow (2012), Rafa et al. (2017), UBOS
(2018a).
Overall productivity between 2002/03 and 2017/17 registered a very modest increase of 1.2 percent. The main contributors to this growth were the non-agricultural sectors: manufacturing (increasing by 2.7 percent) and services (3 percent). Productivity in agriculture essentially stagnated registering a decline of 0.2 percent. What is also obvious from the statistics is high variation in manufacturing productivity (peaking in 2005/06 to 5.6 percent, then declining to 2.9 in 2012/13 and picking up again) and a slow productivity growth in the service sector, which increased by 3 percent over 15 years.
These growth changes came with changes in the employment shares across economic sectors. Whereas agriculture remains the largest employer, it lost 7 percent of its labour force between 2002/03 and 2016/17, and employment in industry and services increased by 1.9 and 5 percent, respectively.
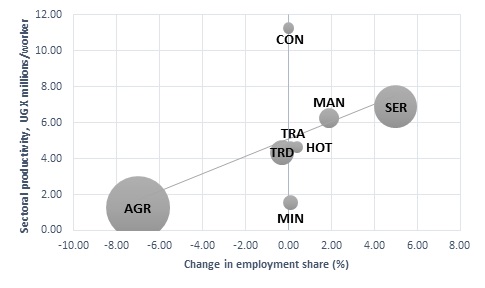
Figure 9 presents the relationship between these two trends, sectoral productivity and employment changes (the changes for subsectors refer to the period 2011/12 – 2016/17).
Figure 9. Sectoral productivity and employment changes, 2002/03 – 2016/17

AGR = Agriculture; CON = Construction; HOT = Accommodation and food; MAN = Manufacturing; MIN = Mining and quarrying; SER = Services; TRA = Transport; TRD = Trade.
Source: Author’s calculations based on Dorosh and Turlow (2012),UBOS (2018a), UBOS (2018b).
The graph shows if shifts in employment across sectors, have been toward productive or unproductive activities. A positively sloped fitting line indicates productivity-enhancing, and hence growth-inducing, structural change. While the overall positive trend is clear, it is also clear that sectors with high productivity, such as manufacturing and construction do not attract much employment due to their capital intensive nature. And whereas the service sector in general has a high productivity and is the main beneficiary of the employment shift, some of the higher productivity activities and, in particular, telecommunications, finance and real estate are not employment intensive and instead rely on a relatively small number of skilled workers.
Most of the higher productivity sectors are concentrated in urban areas, and this concentration increases with the size of the urban centre, that is larger urban centres have more higher productivity activities (Figure 10).
Figure 10. Structural composition of regional economies by share of employment

Over 90 percent of workers in cities and about 80 percent in secondary and small cities are employed in sectors with higher productivity, such as manufacturing, construction, services and such like. As the World Bank (2015) argues, urbanisation has played a major role in Uganda’s transformation by virtue of the highest proportion of production and jobs in the formal sector. Urban areas accommodate more than 70 percent of manufacturing activities and are responsible for 65 percent of new jobs created over the past decade and 70 percent of Uganda’s nonagricultural GDP (World Bank 2015).
This said, we should be aware of the kind of transformation driven by urbanisation: predominantly informal, small-scale and resulting in greater inequality. Most of the increase in urban employment has been driven by micro-firms that on average employ 1.7 workers and have a low survival rate. It is impossible for these firms to benefit from economies of scale and new technologies. 750 of the nation’s largest firms in manufacturing, finance and insurance, construction, and ICT with the highest productivity account for less than one percent of the total working population (BOU 2017). As Brownbridge and Bwire (2016) point out, most of the shifts in the composition of the labour force in Uganda involve ”workers moving from one low productivity sector to another, such as from self-employment in agriculture to self-employment in services or artisanal manufacturing or paid employment in informal microenterprises”.
Our analysis of the business environment in two secondary cities, Gulu and Mbale (Mukuye and Pozhidaev 2020), provides a typical structure of their economies by business location. On average, 70 percent do their business in open markets, on the streets or from their homes and that category is the most diversified to include manufacturing, transporting, trade and production (Figure 11).
Figure 11. Location of business in Gulu and Mbale municipalities

Source: Mukuye and Pozhidaev (2020).
Disputes continue about whether industrialization must be part of structural transformation in SSA or it can transition directly from agriculture to a modern service sector. Bhorat et al. (2019) are convinced that “manufacturing remains the best hope for SSA to generate a large number of good jobs and reduce prospects of political and social instability”. Page (2018) is optimistic that new technologies open in front of African countries a different transformation path based on a growing number of services, such as ICT-based services, tourism, and transport as well as agro-industries including horticulture.
Regardless, structural transformation requires productive capabilities that allow firms to move toward the productivity frontier by offering more diverse and complex products. One way to measure the productive capabilities is by economic complexity index (Hausmann et al. 2014). Presently, Uganda measures negatively on this index (Bhorat et al. 2019), and the kind of structural transformation taking place in Uganda is unlikely to upgrade its productive capability. The present modality of structural transformation has its natural limits defined by the limits of expansive growth based on micro firms and profit ceilings in the service sector dominated 80 percent by retail trade, personal services and other low-tech activities. Uganda’s growth has not resulted in a structural transformation that can be considered self-sustained and capable of progressive evolution in terms of complexity. Uganda’s cities are yet to prove their ability to stand up to this challenge and sustain the country’s economic growth by raising productivity in sectors where the largest proportion of urban residents is employed or alternatively reducing the number of people in low productivity sectors.