Local government fiscal space consists of three main components, own source revenues, intergovernmental fiscal transfers (grants) and borrowing. Considering that the share of borrowing in local government fiscal space in Uganda is negligible, it can be ignored for the purposes of the subsequent analysis.
Total fiscal space of local governments can be represented as

where is the sum of all own source revenues and
is the sum of all intergovernmental fiscal transfers (grants). The fiscal space of local governments displays a clear urban-rural dichotomy with rural governments (districts) being much more dependable on transfers than urban local governments (municipalities and towns) (Table 1). The average share of central government transfers in the total fiscal space of rural governments is 98 percent but drops to about 74 percent for urban local governments. This is a reflection of a higher revenue generating potential of urban governments and their greater financial viability
Table 1: Composition of the local government fiscal space (percentage)
| Average percentage share | ||||
| LGs | Districts | Municipalities | Towns | |
| Transfers | 96 | 98 | 74 | 73 |
| OSR | 4 | 2 | 26 | 27 |
| Total | 100 | 100 | 100 | 100 |
Source: Author’s computations based on the UBOS Government Finance database
Both components of local government fiscal space are dependent on the overall state of national economy. Assuming that the central government intends to keep the grant share of local governments in the total government budget at about the same level, a change in the national GDP implies automatically a change in the local government grant allocation. On the other hand, own source revenues depend on how vibrant local economies are, which is closely correlated with the overall state of national economy and changes in the GDP in particular.
Unsurprisingly, a regression analysis of Ugandan local government fiscal space over a period between 2008/09 and 2017/18 shows a strong and statistically significant correlation between the GDP and transfers (R2 = 0.94) as well as between the GDP and own source revenue collection (R2 = 0.73). In particular, the transfer of grants is sensitive to changes in the GDP with an elasticity of 1.22. The latest IMF Regional Economic Outlook for Africa projects a drop in Ugandan GDP by 2.7 percent, from 6.2 percent to 3.5 percent.[1] UN Economic Commission for Africa projects an average drop of 3.1 percent for its middle-case scenario.[2]
The impact of the COVID-19 pandemic is most significant across all major sources of revenue through both direct and indirect effects. Components such as business licences, user fees and LST have a direct impact while property tax will have indirect but immediate impacts due to reduced business opportunities that have negatively affected the financial ability of tax payers. The conclusion was collaborated by findings from the survey among the senior LG officials.
A Monte Carlo simulation of the COVID-19 impact on the local revenue collection in 2020 is presented in Figure 1. The simulation assumes a 3-month period of strong containment measures followed by a gradual relaxation and recovery over the next 3-4 months.
Figure 1. Level of OSR annual collection with COVID-19 stress added

Source: Author’s computations based on the survey of select local governments.
The most hard-hit sources of revenues include property tax, user fees and other fees, which will be harled. Collectively these sources of revenues account for 82 percent of OSR in districts, 73 percent in municipalities and 78 percent in town councils. On average, own sources revenues account approximately for 4 percent of the total budget of local governments, this amount however varies significantly between different regions and between different types of local governments: districts, municipalities, and townships. In total, local governments are likely to lose about UGX 180 billion. In urban local governments relying more on own source revenues the total fiscal space due to loss of own source revenues will shrink from 5 to 10 percent.
The result of the impact modelling of the drop in own source revenues across different categories of revenues based on the projected local government budget for 2020/21 is presented in Figure 2.
Figure 2. COVID-19 impact on local government own source revenues

Source: Author’s computations based on the UBOS Government Finance database and budget projections The category of other fees will be most affected contributing 30 percent to the overall decline in own source revenues for all local governments. It is followed by property tax and user fees, each contributing about 20 percent. The loss of other fees will be particularly felt in districts where this source of revenue accounts for almost one half of total revenues. The drop on property tax and user fees will affect mostly urban local governments which one average relay on this source of revenue 8-10 percent more than districts.
The previous section has analyzed the impact of COVID-19 on local government own source revenues based on the calibrated data. Applying the results of the regression analysis to the projected local government budget for 2020/21 allows making estimates of the effect on intergovernmental fiscal transfers. The resulting total fiscal gap for three categories of local governments (districts, municipalities and towns) is presented in Figure 3.
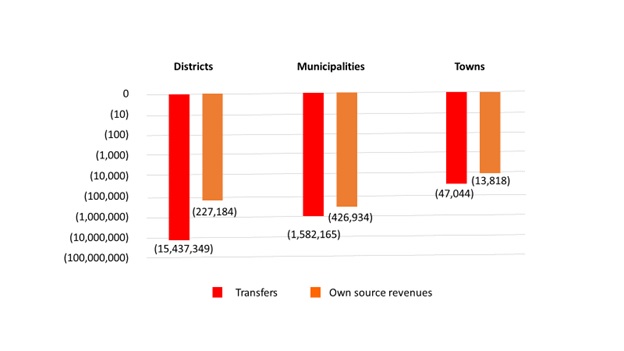
Figure 3. Local government fiscal gap under COVID-19 (UGX millions)

Source: Author’s computations based on the UBOS Government Finance database
The total fiscal gap is projected at UGX 15.7 trillion, with district governments being most seriously affected and accounting for 88 percent of the total loss. The difference between rural and urban governments is explained by the fact that rural governments are more reliant on central government grants and receive about 90 percent of total annual transfers. On the other hand, urban governments will be more affected by the loss of own source revenues accounting for 66 percent of the total own source revenue decrease under COVID-19.
The central government has a limited space for fiscal maneuver at the local level, primarily because of the structure of its transfers, 90% of which consist of earmarked wage and nonwage grants to the relevant sectors. Continued release of these transfers is essential for maintaining basic services and utilities. Hence, there is a concern that the fiscal pressure may cause the central government to reduce the share of development grants. This would be an undesirable outcome with serious longer-term implications for local development and recovery. All efforts should be made to not only maintain the current level of development grants to local governments but also to increase them to maintain the development fiscal space and accelerate post-COVID-19 local economic recovery.
[1] International Monetary Fund (2020). Regional Economic Outlook sub-Saharan Africa. COVID-19: An Unprecedented Threat to Development.
[2] UN Economic Commission for Africa (2020). COVID-19 in Africa:Protecting Livesand Economies.